Inventory is money. And for retailers, inventory literally holds your money until it is somehow moved—by sale, replacement, or loss.
This is why so many retailers keep a close eye on their inventory turnover rate. A company’s inventory turnover rate measures the frequency with which it cycles through inventory. It is often an important indicator that reveals information about customer demand, future planning, and the health of business operations overall.
It’s also an exercise in mathematics (zzz …). To avoid any early onset drowsiness, we’ve broken down inventory turnover ratio in simple terms, including the reasons your own retail business should keep tabs on this important efficiency figure.
How to calculate inventory turnover rate
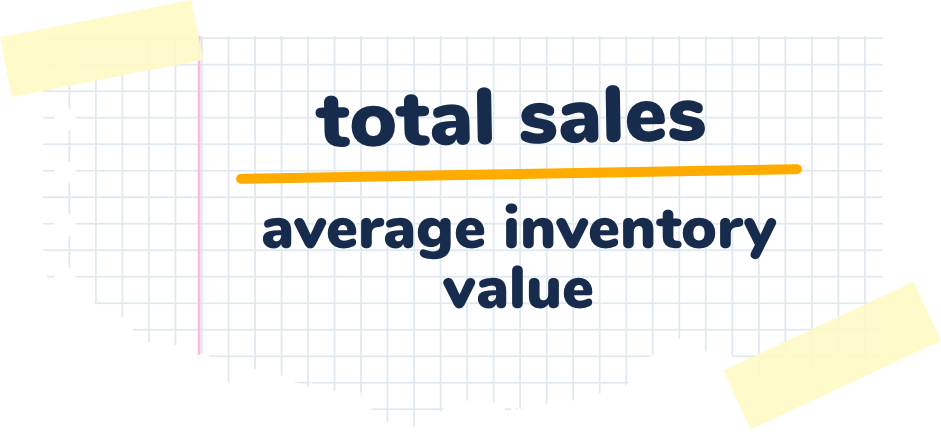
Of course, there are other calculations, such as approximate inventory turnover rate (total sales divided by average inventory value).
Simple Inventory Turnover Formula
Inventory turnover = total sales / ((beginning inventory + ending inventory) / 2)
However, these methods are considered less complete and less accurate indicators compared to inventory turnover rate.
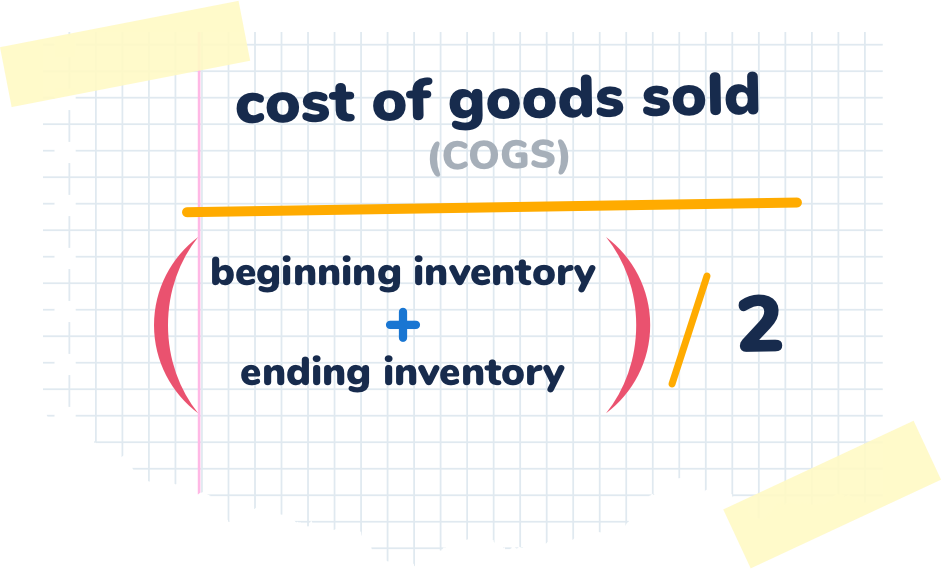
If you’re like most retailers, you calculate turnover over an annual period, which is most common. Your rate is calculated by dividing the cost of goods sold (COGS) by average inventory (beginning inventory + ending inventory / 2).
COGS Inventory Turnover Formula
Inventory turnover = COGS / ((beginning inventory + ending inventory) / 2)
You can then take this number and divide it into 365 to determine your inventory turnover period or Days Sales of Inventory (DSI).
Days of Sales Inventory Turnover Formula
DSI = (COGS / Inventory) * 365
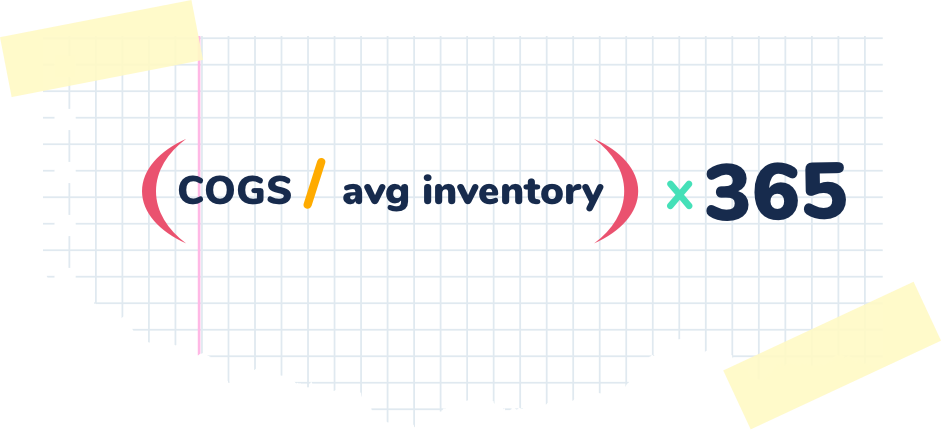
(COGS / Inventory) * 365
Alright, enough with the formulas. Let’s work through a real-world example.
Inventory turnover rate example
It’s December 31st, 2019. You’ve decided that 2020 is going to be the year that you take control of your operations—that you’re going to take the first steps into leaning out your operations while maximizing your productivity.
Let’s also pretend that you are (if you’re not already) a fast fashion retailer who operates a warehouse and sells through a Shopify site or two and maybe some other channels.
Related: Shopify inventory best practices
You started 2019 with 50 pieces of inventory (to keep things simple): 20 shirts, 10 pairs of jeans, 10 pairs of shoes, 5 sweaters, and 5 really-bitchin-sunglasses.
| Started Inventory | |||
|---|---|---|---|
| Item | QTY | Cost Per Item | Total Cost |
| Shirts | 20 | $5 | $100 |
| Jeans | 10 | $15 | $150 |
| Shoes | 10 | $20 | $200 |
| Sweaters | 5 | $8 | $40 |
| Bitchin sunglasses | 5 | $2 | $10 |
| Total | 50 | $500 | |
Throughout the year you bought a couple more items …
| Bought Inventory | |||
|---|---|---|---|
| Item | QTY | Cost Per Item | Total Cost |
| Shirts | 10 | $10* | $100 |
| Jeans | 20 | $10* | $200 |
| Womens Leggings | 10 | $20 | $200 |
| Total | 40 | $500 | |
*Your cost per item will never be static (wouldn’t that be nice!), so let’s have some fun with that too and take that into consideration. We buy more when it’s cheaper and buy less when it’s more expensive.
So you now have $1,000 in total cost of inventory. Let’s see how much you sold this year and how much is remaining …
| Ending Inventory | ||||
|---|---|---|---|---|
| Item | Sold | Ending QTY | Cost Per Item | Total Cost |
| Shirts | 15 | 15 | $5 / $10* | $125 |
| Jeans | 25 | 5 | $10 | $50 |
| Shoes | 5 | 5 | $20 | $100 |
| Sweaters | 5 | 0 | $8 | 0 |
| Bitchin Sunglasses | 5 | 0 | $2 | 0 |
| Womens Leggings | 5 | 5 | $20 | $100 |
| Total | 60 | 30 | $375 | |
*You have some left over shirts from the year prior still so we need to account for that cost (5 remain at $5 per item).
Now lets calculate our COGS:
Calculation:
COGS = Beginning Inventory + Purchases During the Period – Ending Inventory
So our COGS = $500 + $500 - $375 == $625
Now to calculate our turnover rate:
625/((500+375)/2) = 1.42
Our DSI: (1 ÷ 1.42) x 365 == 257 days
This means we will turnover our inventory every 257 days. This is awfully low, and indicates a few things.
Now, given our super small sample size, we wouldn’t normally think too much into it. But since we are going into 2020 with the goal of maximizing our operations, we should focus on our purchasing behaviors (in this case, over buying) and try to get rid of inventory that isn’t selling as well as we hoped (t-shirts).
Inventory turnover rate
To calculate your inventory turnover rate, divide your cost of goods sold (sometimes called Cost of Sales or Cost of Revenue) by your average inventory.
The resulting rate will give you the number of times that you turn over inventory in a given time period, which can be converted to days. For example, a turnover ratio of 4 means your inventory turnover period lapses every 91 or so days (365/4).
NOTE: Usually, COGS and average inventory are taken over the same twelve-month period, though some retailers will calculate inventory turnover more frequently.
Why is inventory turnover important?
For whatever reason, inventory turnover is one of those calculations that gives retailers the heebie-jeebies. It conjures flashbacks to the days of analog when retailers and accountants would calculate everything by hand, using paper, pen, and massive ledgers.
This is especially true of smaller businesses without formal or automated inventory management processes.
Still, a retailer’s ability to consistently turn stock on hand into cash will impact other areas of business. We mentioned that the longer you hold inventory, the more your holding costs will grow. This, in turn, will affect things like revenue and profit margin.
Many retailers use inventory turnover rate to estimate how quickly they might expect to generate profit, or what their cash flow might look like during the next fiscal period. Indeed, inventory turnover rate can tell you a couple of things. For example:
Low inventory turnover rate might indicate that demand is lagging over a given year or period of years historically. Generally speaking, the fewer items sold in a given inventory period, the longer a company’s cash is tied up in that inventory. This is cash that cannot immediately be put toward paying salaries or evening up with lenders and suppliers.
A low turnover rate can also impact a company’s ability to accurately forecast for budgeting, inventory purchase decisions, and sales. If sales will be lagging behind what a retailer has purchased, for example, warehouse inefficiencies may result (you don’t want inventory items taking up valuable space for too long, for example.
High inventory rate might indicate that demand for your stock consistently high. It can also, however, point to inefficient purchasing practices or pricing. In addition, too high of an inventory rate could lead to stock shortages that translate to lost business or dissatisfied customers.
Make the most of it by considering industry and limiting inefficiency
Retailers can read a lot into their inventory rate, but the number says very little in and of itself. Our recommendation is to always compare your own turnover rate against other retailers in your vertical, or at least against industry averages. Low or high inventory can mean something different depending on the industry, organizational maturity, and other factors.
More importantly, then the fact that you measure inventory turnover is how. In many ways, your turnover rate is an indicator of efficiency—warehouse efficiency, purchase efficiency, and proper pricing. Biased though we might be, we do know of one rock-solid way you can dial in your turnover and get the most out of inventory.
Let RetailOps take care of inventory management for you
With automated inventory management from RetailOps, you’ll be able to easily pull any reporting you need, on demand, share it with key stakeholders, and make strategic inventory decisions based on hard data. Contact us today to talk to an expert.